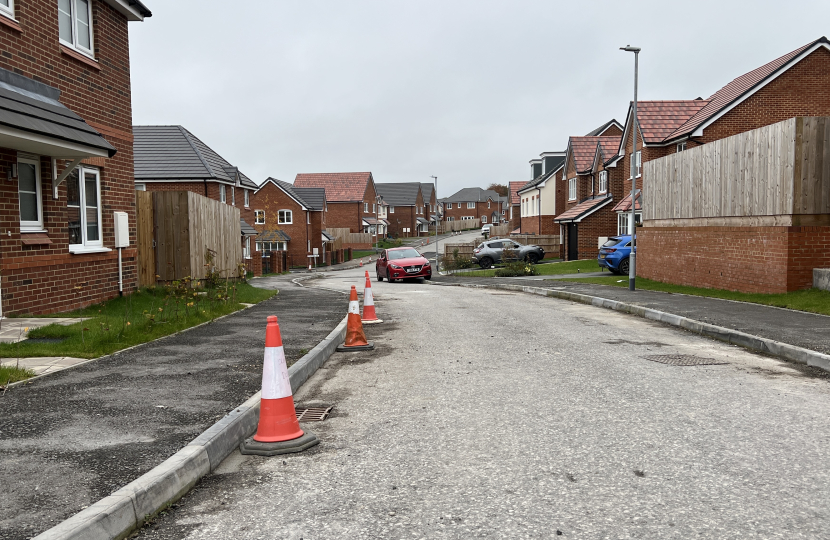
Labour are threatening to instruct local councils like Chorley to redraw the Greenbelt.
What do you think?
Let us know in our survey at the end of this page.
| Green Belt land by current parliamentary constituency | ||||
| England, As at 31 March 2023 | ||||
| ONS code | Constituency | Green Belt land (hectares) | Total area (hectares) | % Green Belt |
| E14001102 | Blackburn | 970 | 3,960 | 24.5 |
| E14001104 | Blackpool North and Fleetwood | 560 | 3,410 | 16.3 |
| E14001105 | Blackpool South | 10 | 2,620 | 0.4 |
| E14001170 | Chorley | 8,240 | 13,670 | 60.3 |
| E14001242 | Fylde | 1,930 | 17,430 | 11.1 |
| E14001299 | Hyndburn | 4,230 | 9,030 | 46.9 |
| E14001318 | Lancaster and Wyre | - | 40,750 | - |
| E14001372 | Morecambe and Lunesdale | 1,540 | 82,380 | 1.9 |
| E14001422 | Pendle and Clitheroe | 2,130 | 23,690 | 9.0 |
| E14001433 | Preston | 420 | 4,040 | 10.4 |
| E14001443 | Ribble Valley | 4,180 | 64,880 | 6.4 |
| E14001450 | Rossendale and Darwen | 7,140 | 21,820 | 32.7 |
| E14001491 | South Ribble | 11,230 | 14,040 | 80.0 |
| E14001577 | West Lancashire | 23,110 | 26,240 | 88.1 |


